Open weather data, read in context.
Built on open atmospheric data: snow, air pressure, weather history, UV, pollen and air quality. Each app puts its number in context: a trend, a map or the years before it.
Six apps, one family
Our Apps
Free, for your city, in up to 13 languages.
Snowy Today NEW
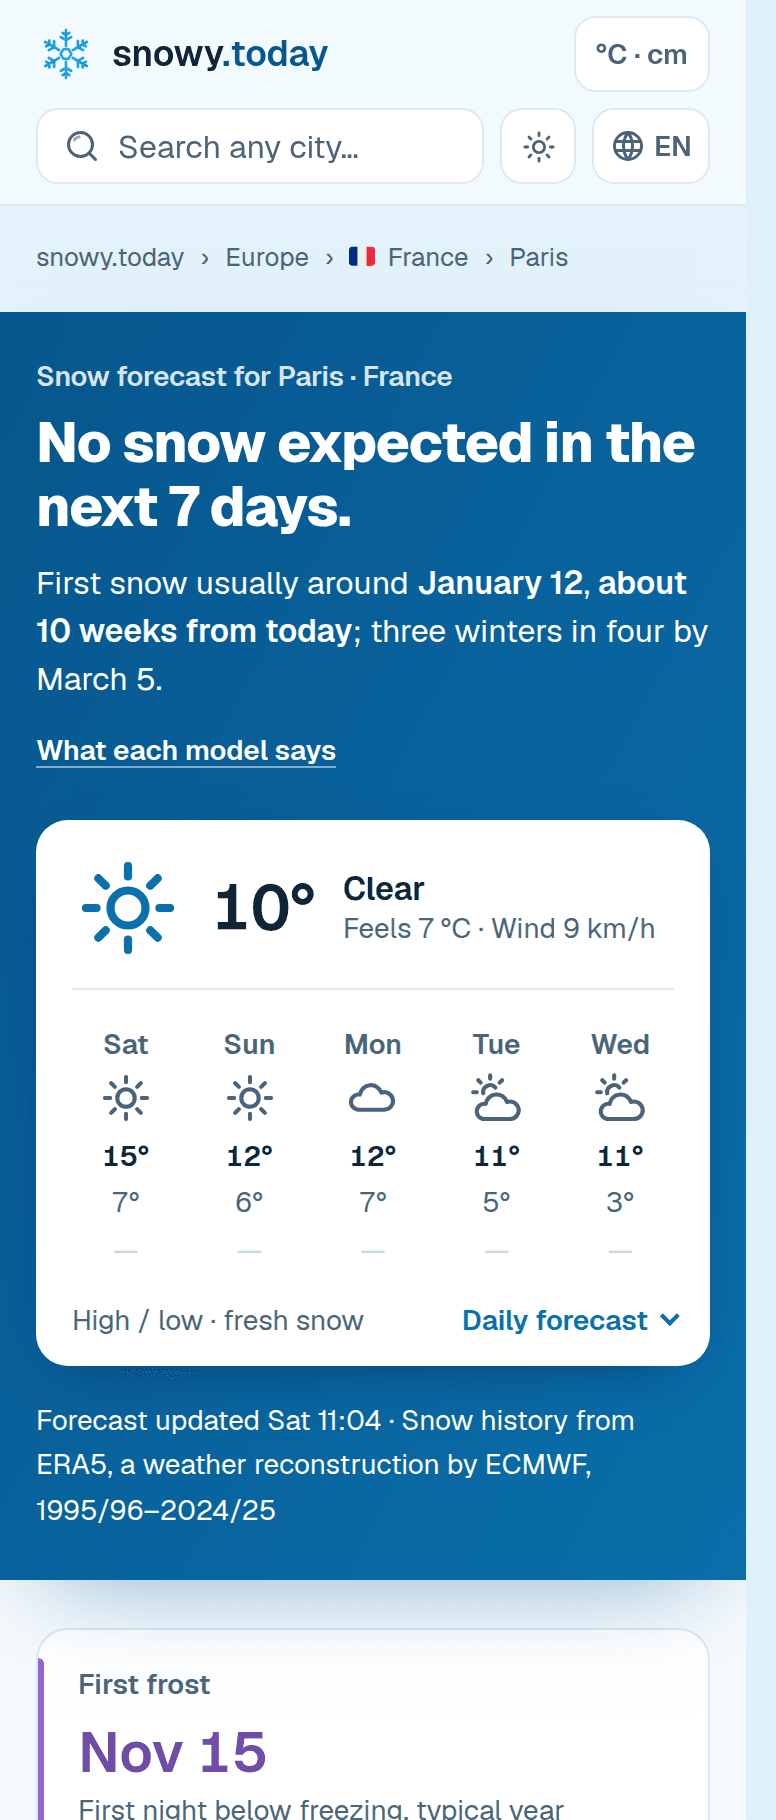
Will it snow? And does it usually, by now?
Snow forecast and snowfall history for cities worldwide. The forecast: a plain answer, the expected amount and a 7-day outlook, with every weather model's figures side by side. The history: 30 winters of ERA5 statistics per city — average snowfall, first and last snow dates, snow days, snow depth, frost dates, white-Christmas odds and how recent winters compare with the long-term trend.
Barometer Today LIVE
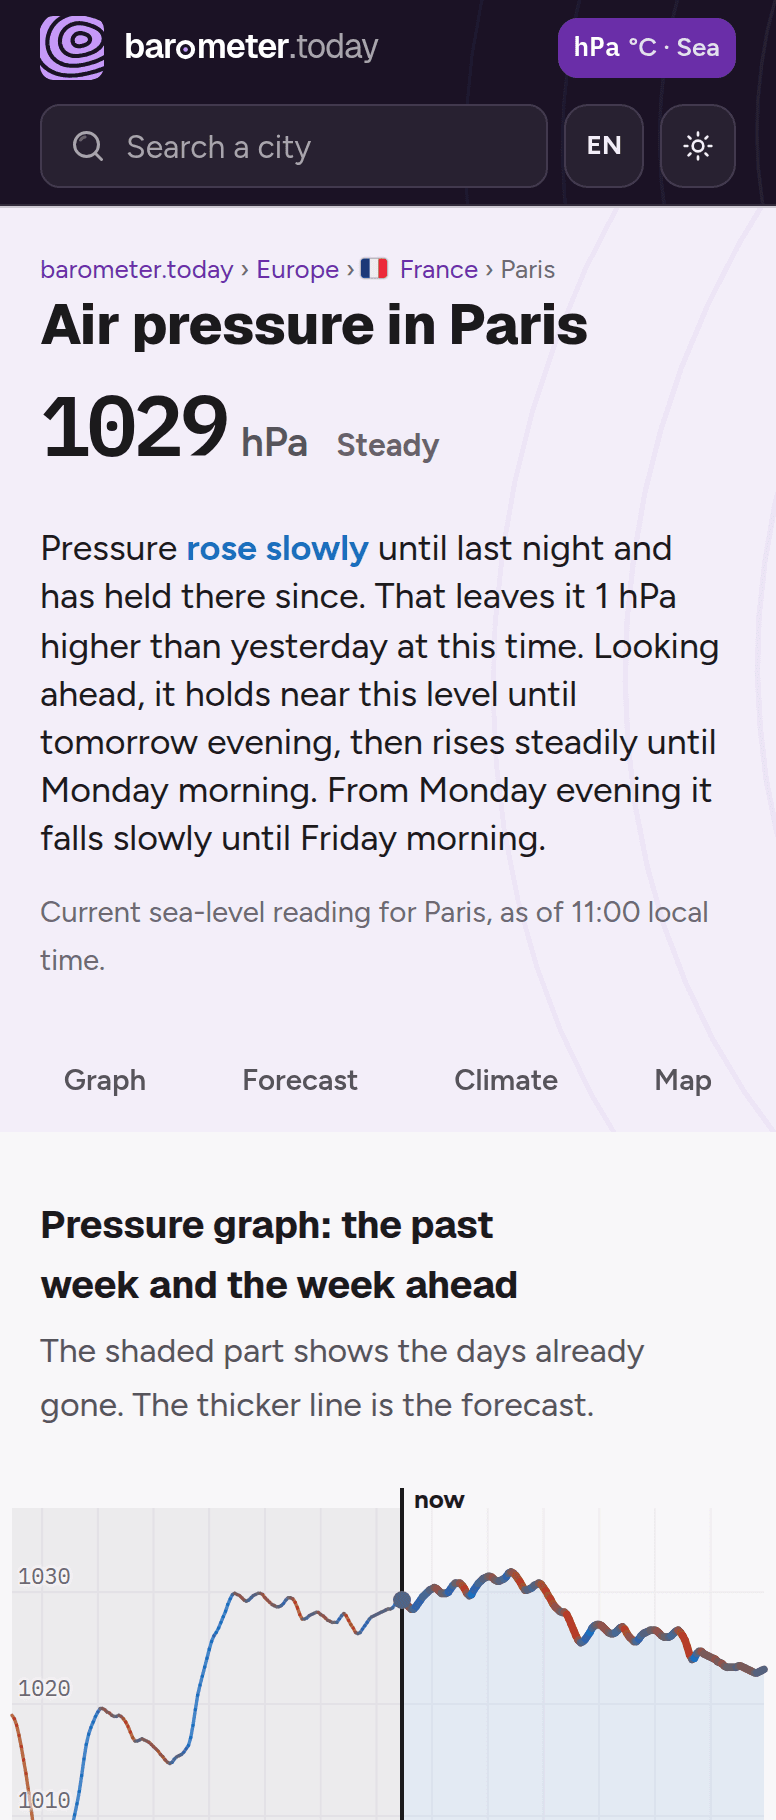
Barometric pressure, and which way it is going
Sea-level pressure for cities worldwide, with the 24-hour change written out in plain words. An hour-by-hour graph of the days behind and the week ahead, plus what a barometer would read at the city's own altitude.
Weather Journey LIVE
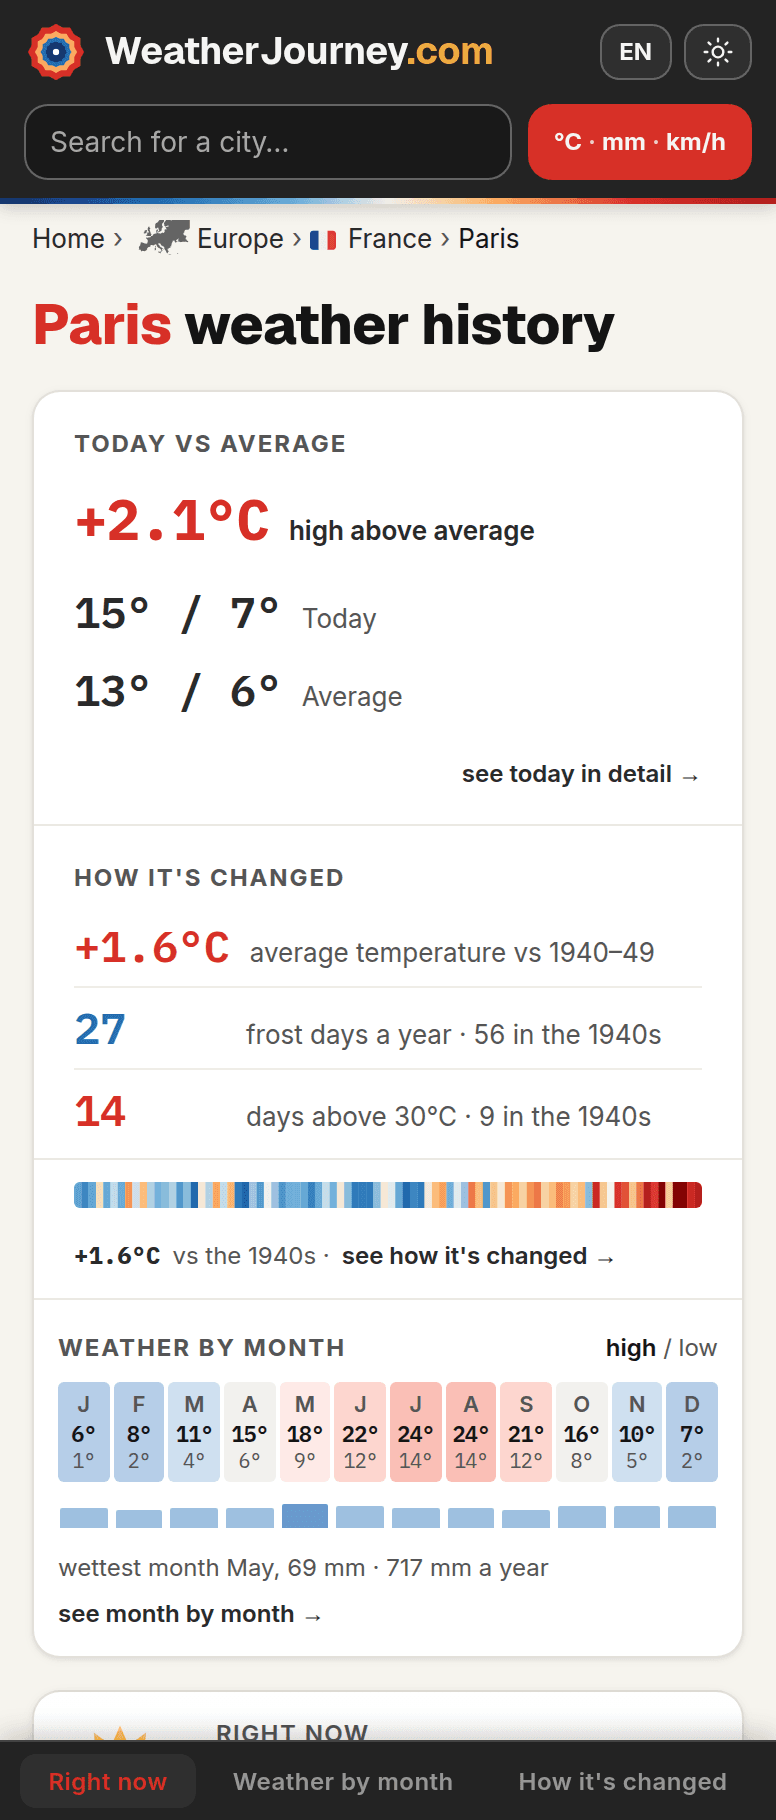
Historical weather data for 6,000+ cities — since 1940
Look up monthly temperature averages, all-time records, precipitation history, and climate anomalies for major cities worldwide. See how today compares to 85 years of data.
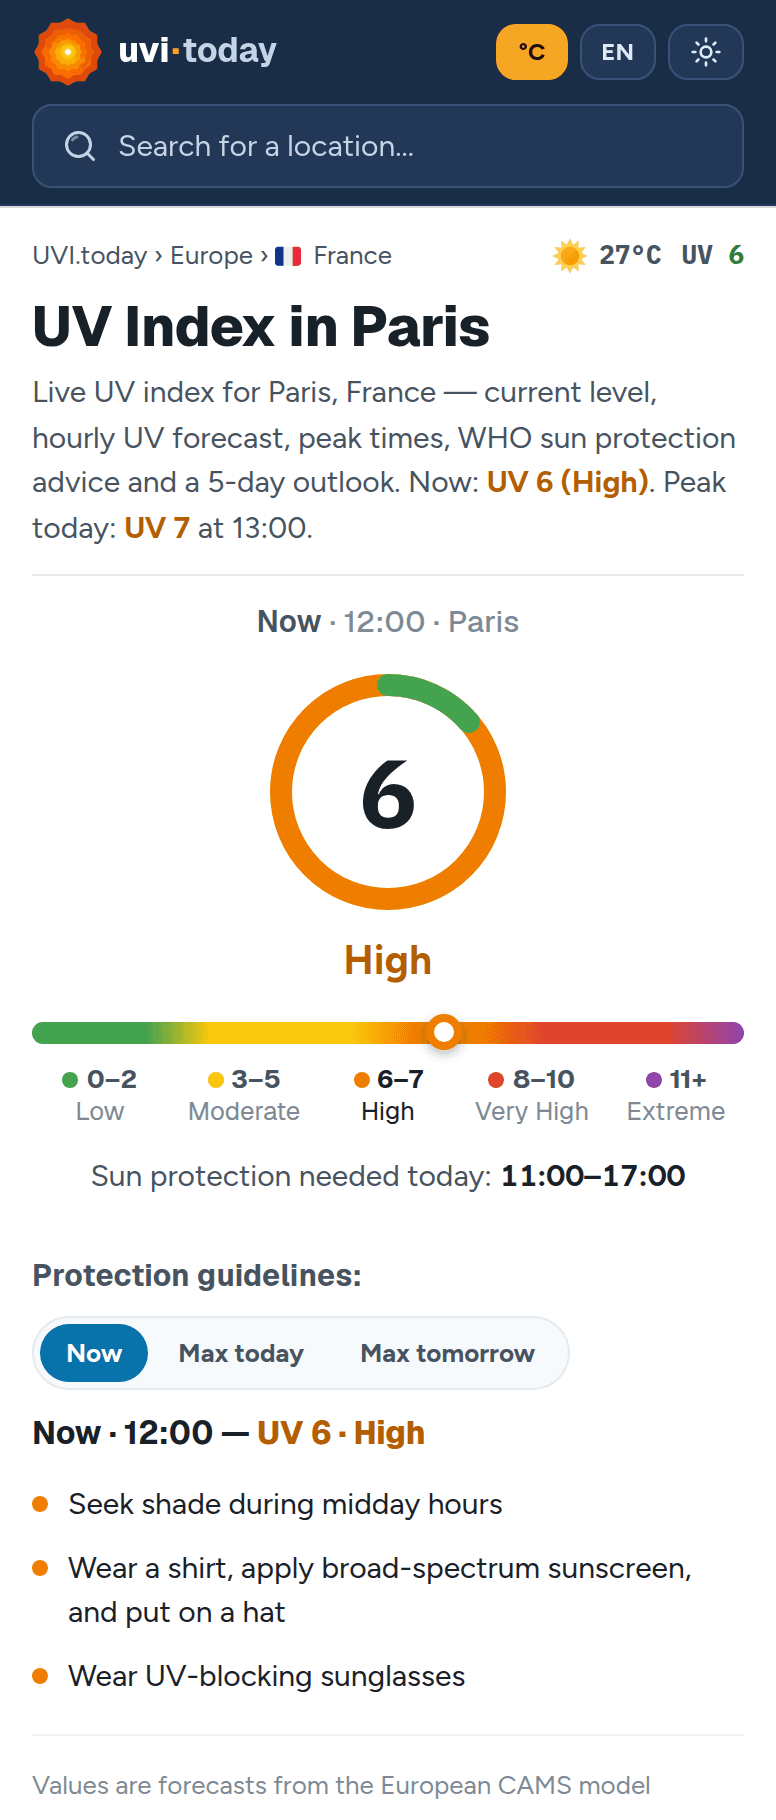
UVI Today LIVE
Know your UV risk before you step outside
Check the real-time UV index for any location worldwide. Hourly forecasts, 5-day UV trend, sunrise/sunset times, and WHO sun protection guidance — all in one place.
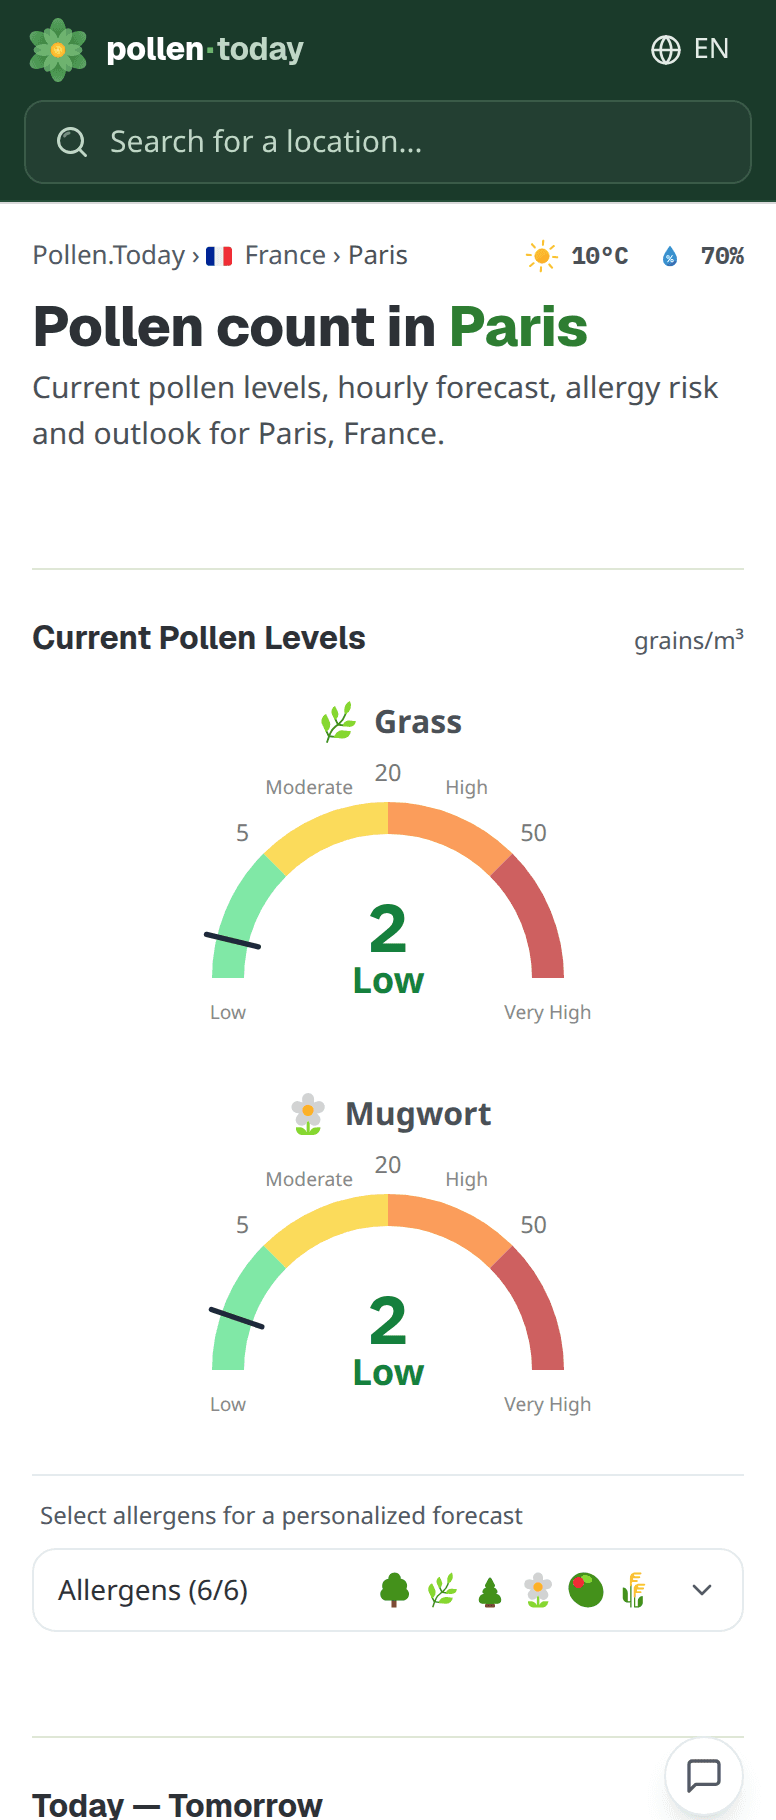
Pollen Today LIVE
Daily pollen levels for 6 allergen types
Pollen forecasts for alder, birch, grass, mugwort, olive, and ragweed. Just open it and check your area.
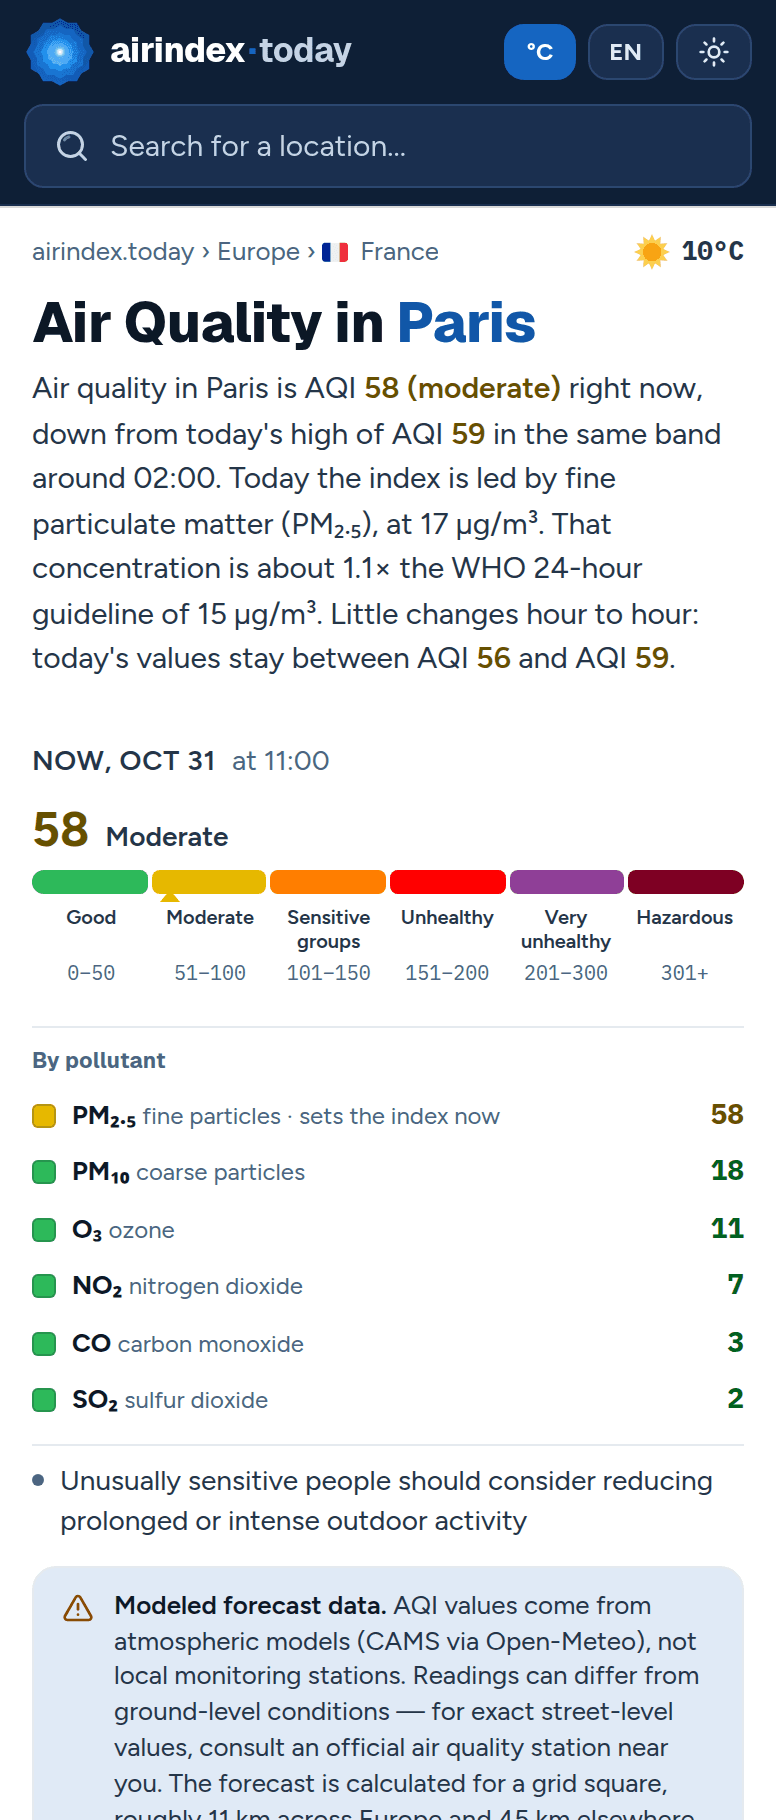
Air Index Today LIVE
Real-time air quality index for any city worldwide
Hourly AQI forecast, 5-day trend, and pollutant breakdown (PM2.5, PM10, NO₂, O₃, SO₂, CO). Health advice per the EPA AQI scale.
One idea, six apps
Start with the number. Then show what's behind it: the trend, the years before, the other models. That's how you tell a normal day from a strange one.
barometer.today
The trend, not a snapshot
The week behind and the week ahead on one line, so “1029 hPa” becomes “steady, then falling from Monday”.
weatherjourney.com
Today against every year since 1940
Every year of this date since 1940, with today marked. Warmer or cooler than usual stops being a feeling.
snowy.today
A whole year at a glance
Thirty winters of ERA5 folded into one typical year: afternoon highs, night lows, frost and the days snow usually lies.
All of it on open data: forecasts from Open-Meteo, climate history from ECMWF's ERA5 reanalysis since 1940, UV, pollen and air quality from Copernicus CAMS. Snow forecasts show every model's figures side by side. Every app is localized, with local units and dates, so the numbers read the way you're used to.
Got an idea or want to work together?
We're always interested in new environmental data projects, partnerships, or just a good chat about the weather.
