5 apps · open data · ECMWF · ERA5 · CAMS
Free weather & environment apps
Five free environmental tools built on open weather and climate data: air pressure, climate history, UV index, pollen and air quality. No account or location permission required — just open and check.
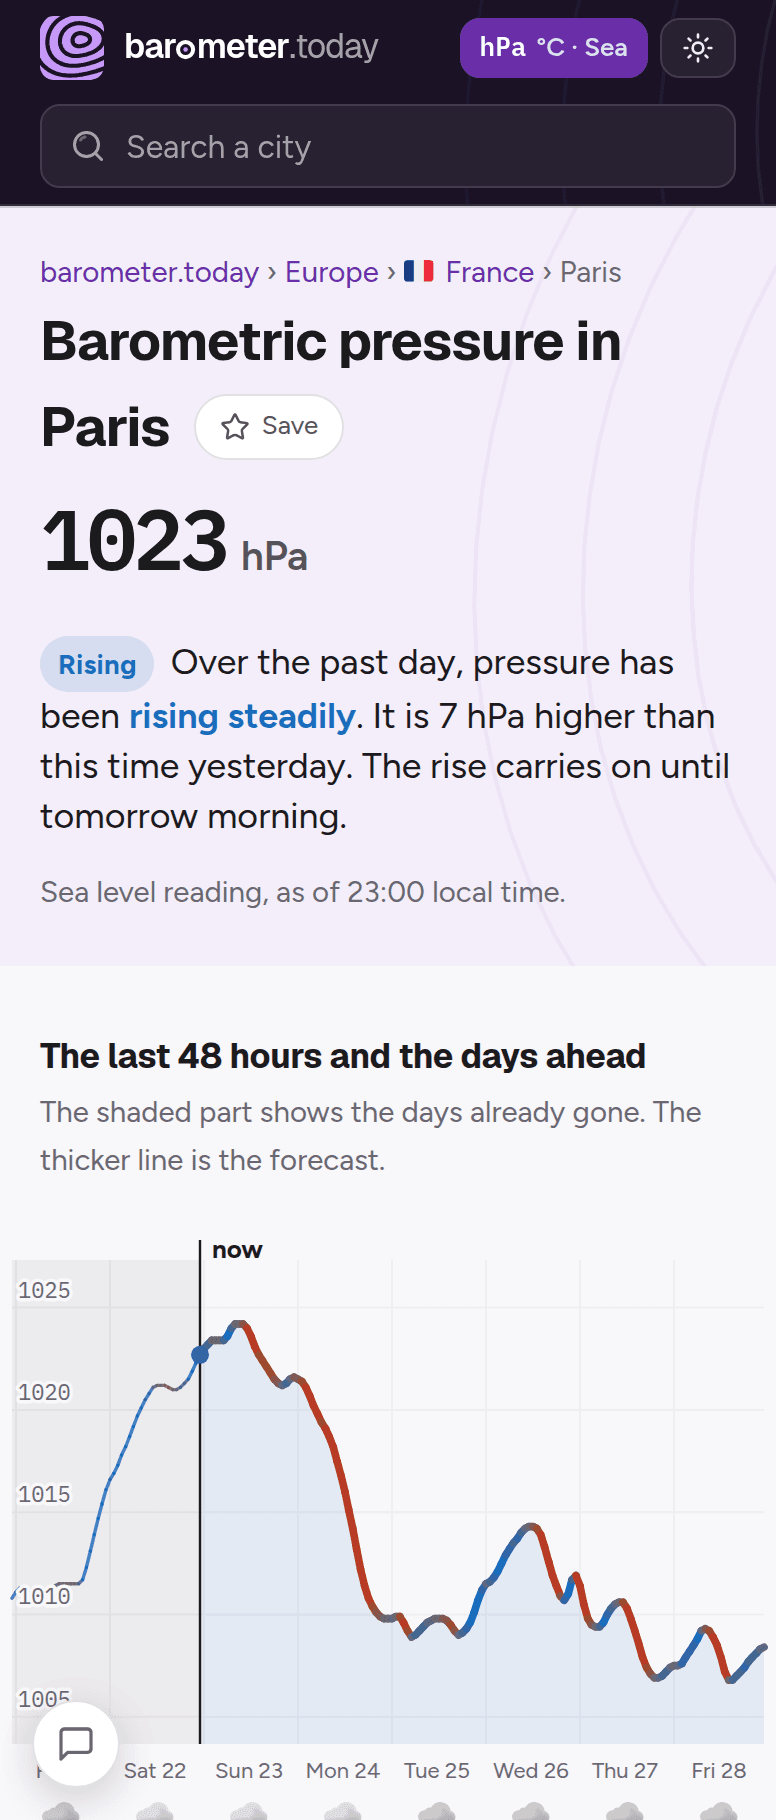
Barometer Today is a free reference for barometric pressure and, more usefully, for the direction it is heading. Every city page leads with the current sea-level pressure and then says in plain words how far it has moved over the past 24 hours: “up 8 hPa over the last 24 hours” answers far more real questions than the bare number does. Below that sit an hour-by-hour trace of the days behind and the week ahead, a sentence for each of the next seven days, and the daily rhythm where it is large enough to matter.
Figures come from the ECMWF IFS model at 0.25° resolution, served through a self-hosted Open-Meteo instance. Pressure is reduced to sea level everywhere, which is what national weather services publish and what makes two cities comparable; a high-altitude city also gets a clearly labelled second figure for what a barometer standing there would actually read. The site publishes no symptom forecast and no health scale: it says what the air is doing and leaves the conclusions to the reader.
Features
- ✓Current sea-level pressure for cities and towns worldwide
- ✓The 24-hour change, written as a sentence rather than an arrow
- ✓One graph, 7 days ahead, with the past shown as 48 hours, a week, or as far back as the data reaches
- ✓A plain-language card for each of the next seven days
- ✓Pressure at the city's own altitude, labelled, where elevation matters
- ✓hPa by default, with mmHg, inHg and kPa on request (1 hPa = 1 mbar)
- ✓Reference pages on method, units and altitude, each dated
- ✓No account, no cookies at all, installable as a PWA
Data sources
- Pressure forecast: ECMWF IFS via Open-Meteo (open-source, commercial-use license)
- City names and coordinates: GeoNames (CC BY 4.0)
- Elevation: Copernicus DEM via Open-Meteo
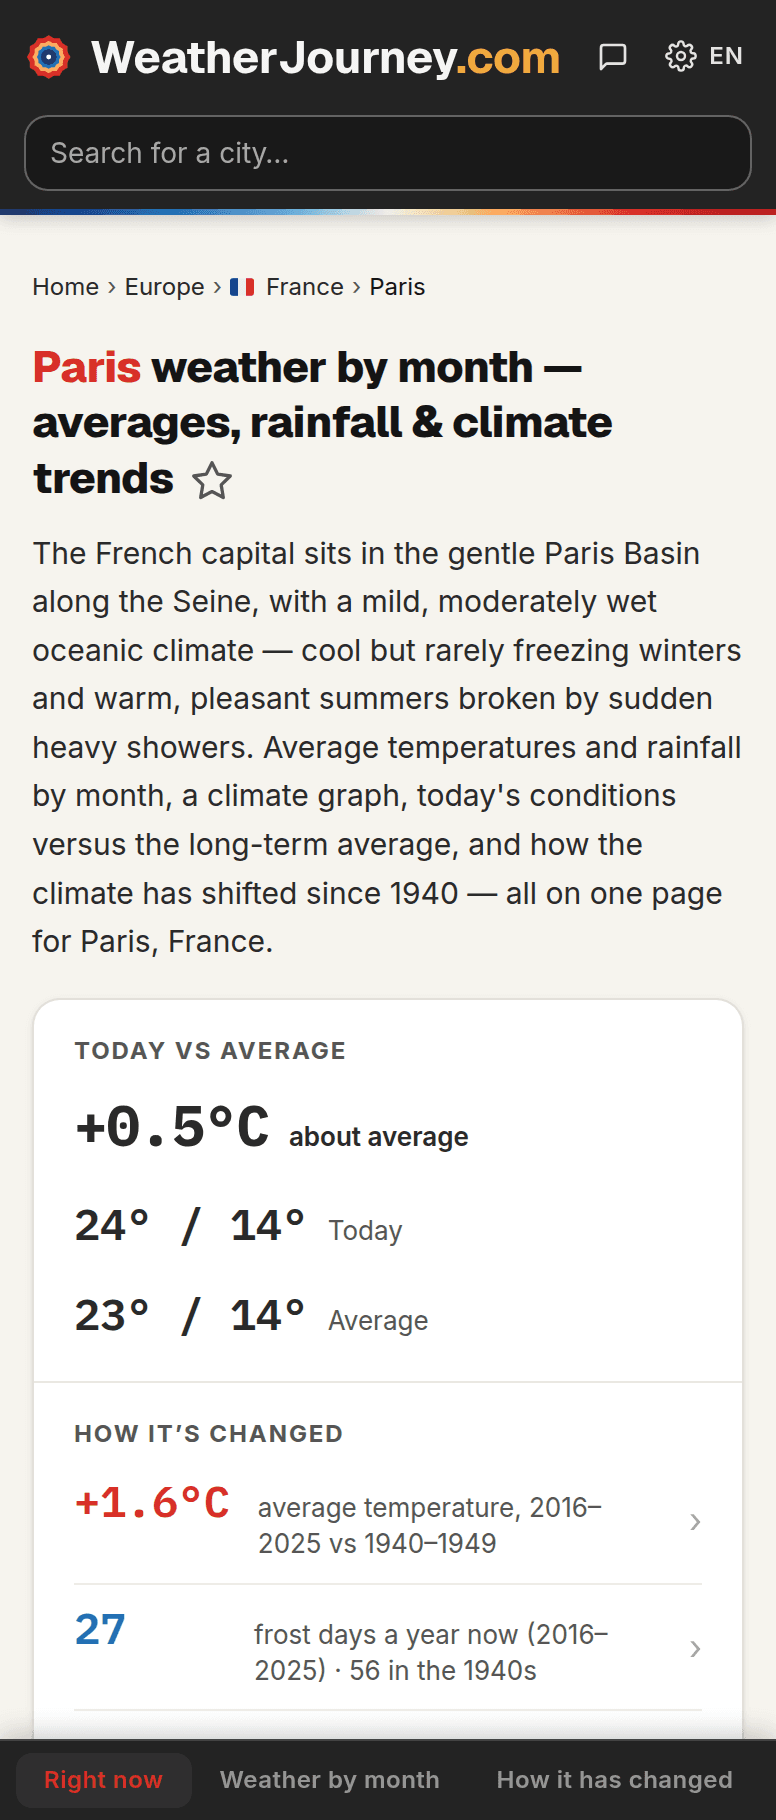
Weather Journey is a free historical weather service for 6,000+ major cities worldwide. Look up monthly average temperatures, all-time records, precipitation history, and climate anomalies going back to 1940 — then compare them to what's happening right now. Whether you're researching past weather events, planning a trip, or just curious how this January compares to every January on record, Weather Journey puts 85 years of data at your fingertips.
All historical climate data is built on ERA5, a scientific reanalysis of the global atmosphere produced by ECMWF. ERA5 covers the full period from 1940 to present on a consistent 31 km grid — making it the most reliable foundation for long-term weather trend analysis available without a subscription.
Features
- ✓Historical weather data from 1940 to present for 6,000+ major cities
- ✓Monthly average temperature, record highs, record lows, and anomalies
- ✓Monthly and annual precipitation history with long-term trend line
- ✓Today vs. average — is it warmer or colder than usual for this date?
- ✓Right now: live conditions with historical context side by side
- ✓Available in English, German, French, and Spanish
- ✓No account required, no personal data stored
Data sources
- Climate reanalysis: ERA5 (ECMWF, open access)
- Current conditions: Open-Meteo (open-source, commercial-use license)
- Geolocation: IP-based, server-side only
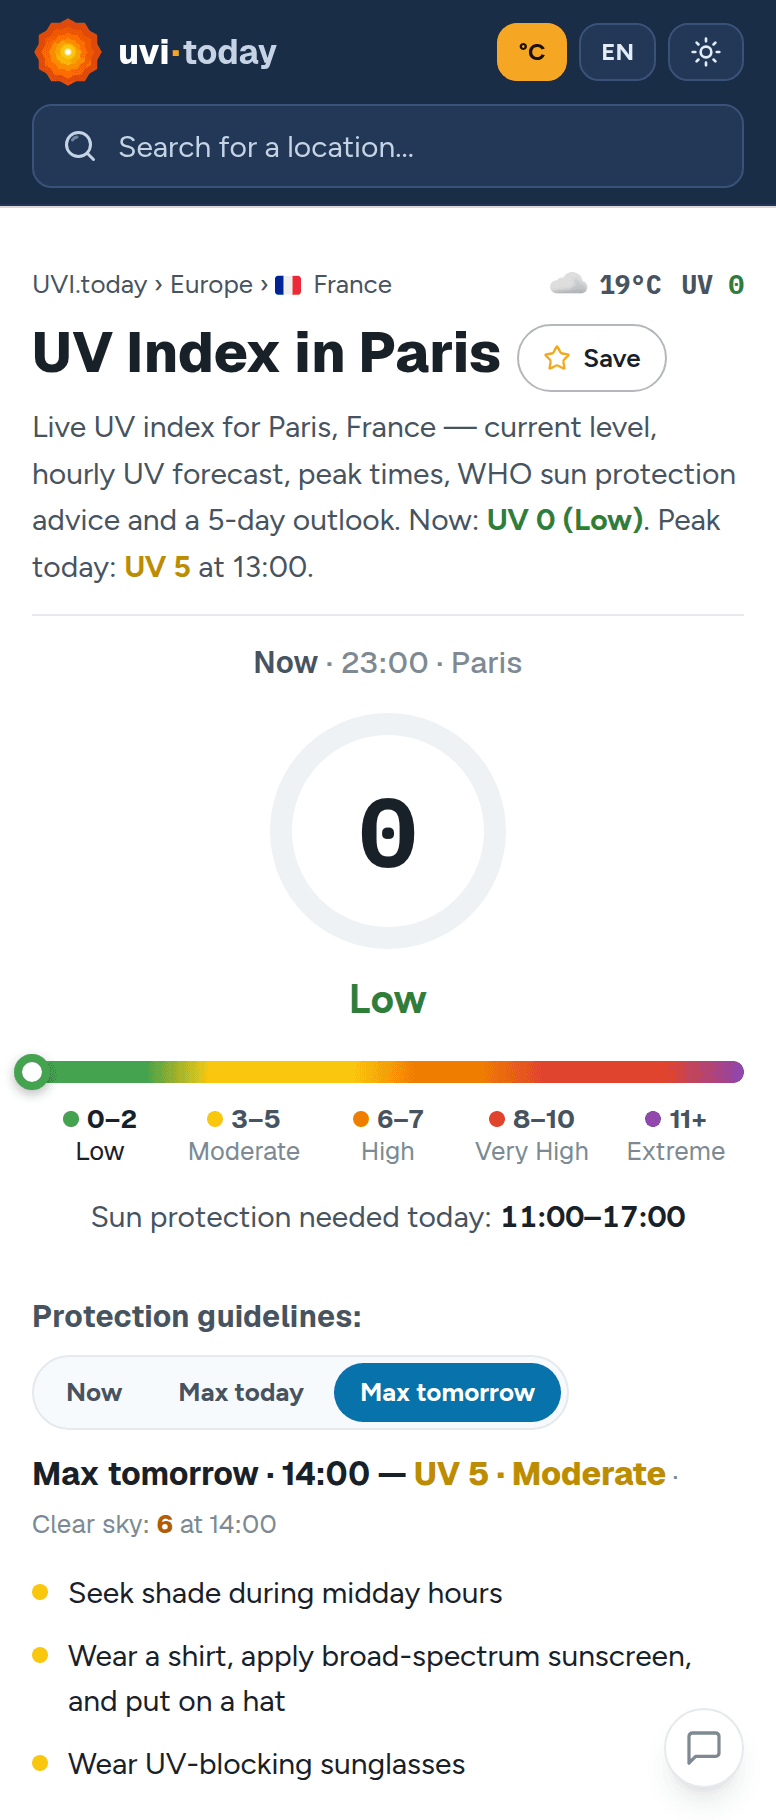
UVI Today is a free UV index forecast service. It shows the current UV level, hourly forecasts for today and tomorrow, a 5-day UV trend, sunrise/sunset times, and sun protection recommendations based on WHO guidelines. Your location is resolved via server-side IP geolocation — no browser prompt and no tracking.
UV index values are sourced from the Open-Meteo API, which derives its UV forecast from the Copernicus Atmosphere Monitoring Service (CAMS) operated by ECMWF. The five-level exposure scale (Low / Moderate / High / Very High / Extreme) follows the WHO classification.
Features
- ✓Real-time UV index for any location worldwide
- ✓Hourly UV forecast for today and tomorrow
- ✓5-day UV trend overview
- ✓Sunrise and sunset times
- ✓WHO-based exposure category (Low → Extreme)
- ✓Automatic location via IP geolocation — no browser prompts
- ✓No account required, no personal data stored
- ✓Mobile-friendly, installable as a PWA
Data sources
- UV index: Open-Meteo (open-source, commercial-use license)
- Atmospheric model: CAMS / ECMWF
- Geolocation: IP-based, server-side only
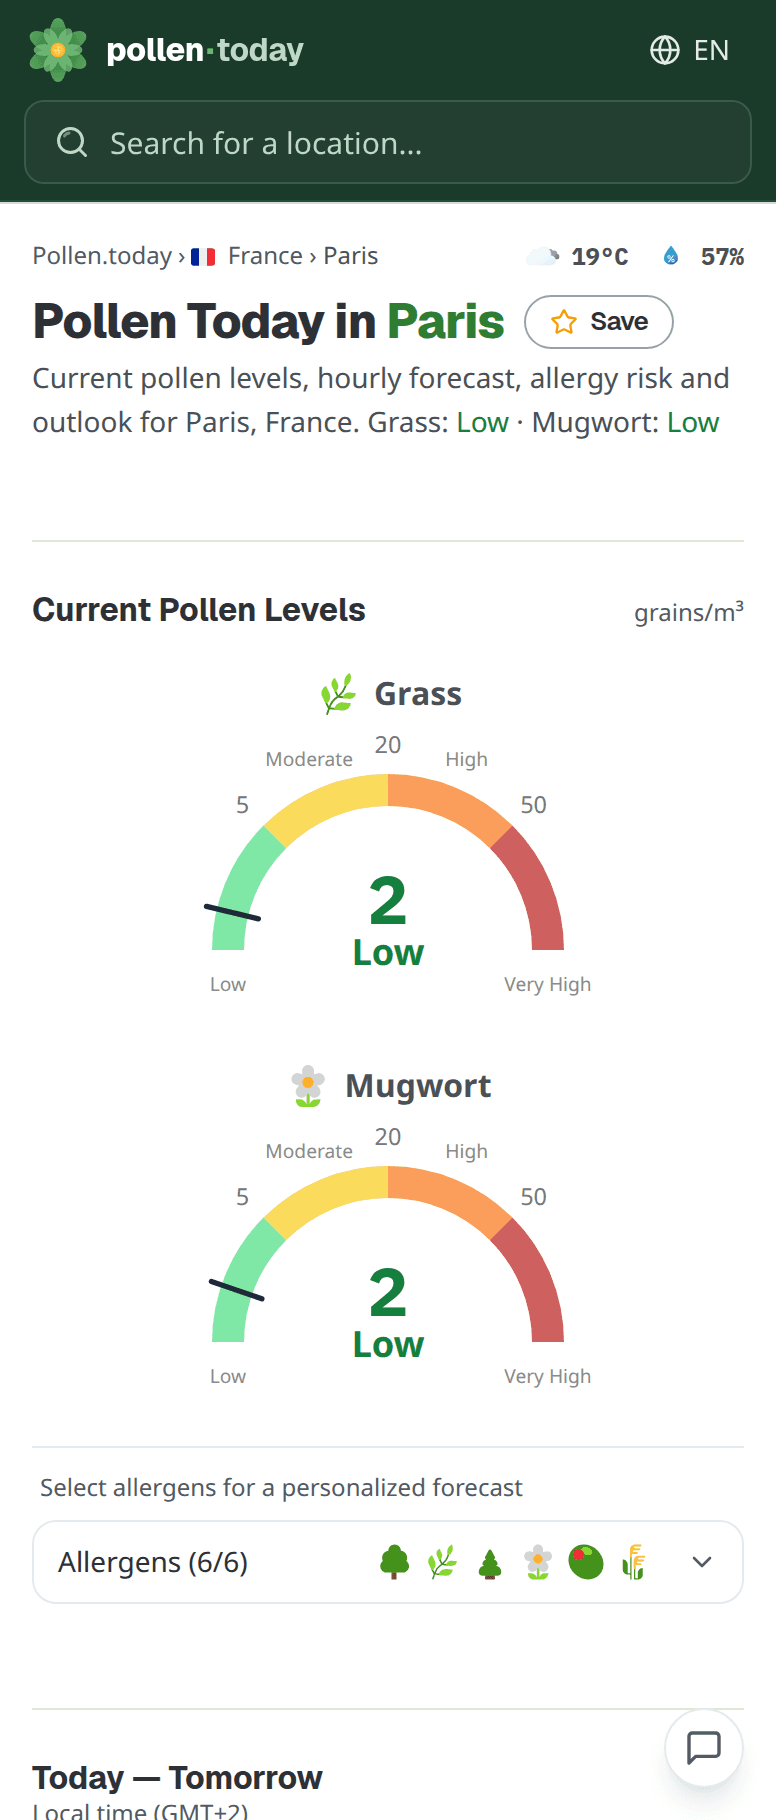
Pollen Today provides daily and multi-day pollen forecasts for six major allergenic plant types. The app covers European locations within the CAMS pollen model domain and resolves your location automatically — no browser prompts, no sign-up.
Pollen concentration data comes from the Open-Meteo API, which processes Copernicus CAMS pollen forecast output (SILAM model). The Low / Moderate / High / Very High scale follows EAACI threshold guidelines per pollen type.
Features
- ✓Daily pollen forecast for 6 plant types: alder, birch, grass, mugwort, olive, ragweed
- ✓Multi-day forecast (several days ahead)
- ✓Low / Moderate / High / Very High scale per EAACI thresholds
- ✓Automatic location via IP geolocation — no browser prompts
- ✓Coverage: European locations (CAMS pollen model area)
- ✓No account required, no personal data stored
Data sources
- Pollen forecast: Open-Meteo (open-source, commercial-use license)
- Atmospheric model: CAMS / ECMWF (SILAM dispersion model)
- Geolocation: IP-based, server-side only
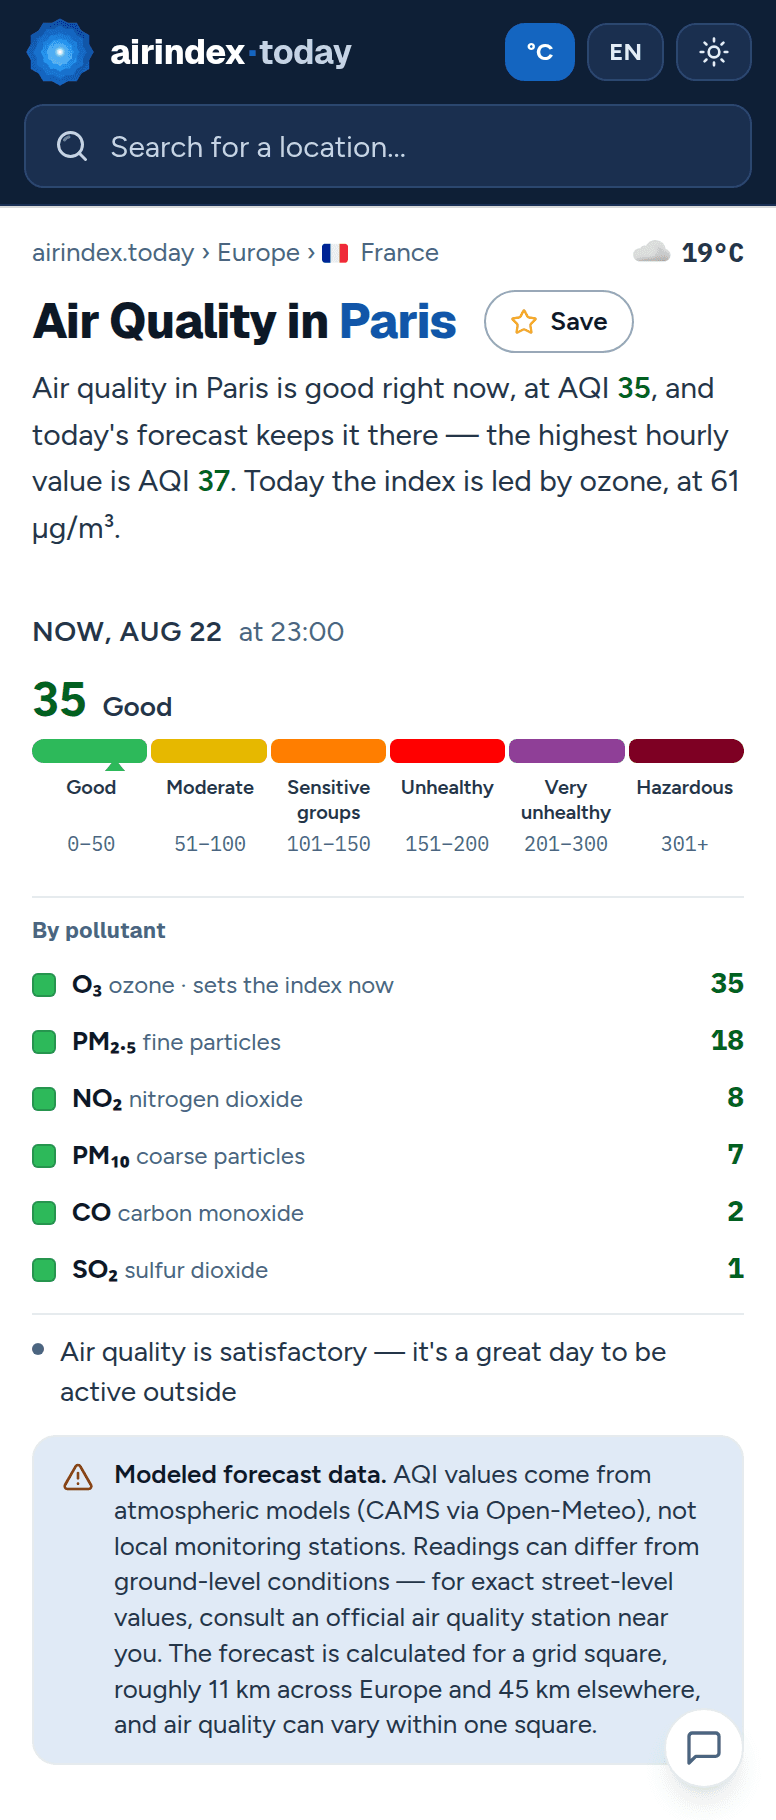
Air Index Today is a free air quality index (AQI) service. It shows the current AQI for any city, hourly forecasts for today and tomorrow, a 5-day AQI trend, individual pollutant levels, and health advice based on the EPA AQI scale. Your location is resolved via server-side IP geolocation — no browser prompt and no tracking.
Air quality data is sourced from the Open-Meteo Air Quality API, which derives its forecasts from the Copernicus Atmosphere Monitoring Service (CAMS) operated by ECMWF. The six-level AQI scale follows the U.S. EPA classification.
Features
- ✓Real-time AQI for any city worldwide
- ✓Hourly AQI forecast for today and tomorrow
- ✓5-day AQI trend overview
- ✓Pollutant breakdown: PM2.5, PM10, NO₂, O₃, SO₂, CO
- ✓EPA AQI scale: Good → Hazardous
- ✓Health advice per AQI level
- ✓Automatic location via IP geolocation — no browser prompts
- ✓No account required, no personal data stored
- ✓Mobile-friendly, installable as a PWA
Data sources
- AQI & pollutants: Open-Meteo (open-source, commercial-use license)
- Atmospheric model: CAMS / ECMWF
- Geolocation: IP-based, server-side only
More apps coming
We're working on additional open-data environmental tools. If you have a suggestion or want to get in touch, drop us a line.
